Where Are The Audiences? 2018 - Targeted Audiences Report

Where are the audiences? Targeted - Māori, Pacific, 15-24 yr olds and lower socio-economic New Zealanders.

Overview

Alongside the release of the Where Are The Audiences? 2018 report NZ On Air partnered with the Health Promotion Agency to commission four separate reports on specific target audiences - Māori, Pacific, 15-24 yr olds, and lower socio-economic New Zealanders.

These reports compare weekly and daily media use across a range of platforms, providing a single source of objective media information.

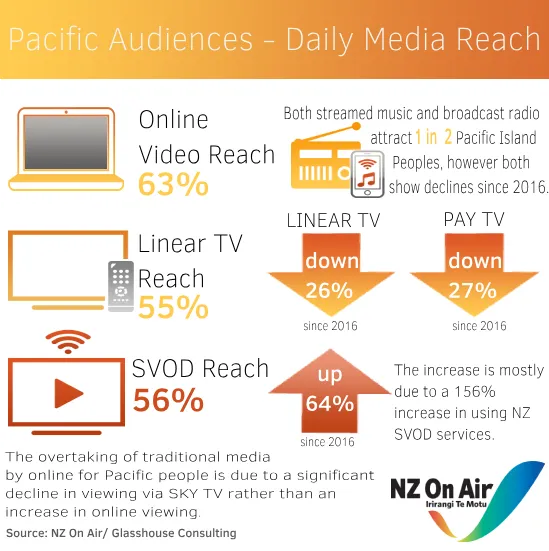
You can read all the key findings below.

Key findings - 15 - 24 year olds
  • The top three daily media used by this age group are all Online
    • Significantly higher daily users of Online video eg YouTube, Facebook (78% v 52%)
    • Significantly higher daily users of streamed/online music (78% v 39%)
    • Significantly higher users daily of SVOD (56% v 37%)
  • Significantly lower users of Free-to-air TV (25% v 37%)
  • Significantly lower users of live radio (45% v 55%) but relatively stable.

Among this age group NZ SVOD use has almost doubled in 2 years (increasing from 29% daily use in 2016 to 46% in 2018).

  • This is also the media 15-24 year olds use for the greatest time each day – more than 3 hours a day.

At the same time linear TV use has fallen 31% in 2 years (driven largely by dropping out of SKY TV but also a decline in free-to-air TV.) And enjoying music on physical formats (CD, ipod etc) has fallen 54% in 2 years.

This age group also uses OnDemand differently to the general population. 41% use it to watch original content that is not catch up viewing. (v 32% general population).

Read full report below:

15-24's final infographic
Key findings - Māori audiences
  • Significantly higher daily use of Online video eg YouTube, Facebook (62% v 52%)
  • Significantly higher daily use of SVOD than general population (52% v 37%)
  • Significantly higher users of OnDemand daily (39% v 19%)
  • Slightly less use than the general population of linear TV daily (63% v 66%)
  • Lower users daily of radio than general population (48% v 55%)

The generation gap in media use is roughly the same as for the general population but bear in mind the Māori population profile is young (70% aged under 40).

  • In the younger demographic of 15-39 (which is the major Māori population group) the evidence is most clear of online media overtaking traditional media.

Read full report below:

Maori FINAL infographic
Key findings - Pacific audiences
  • Number one daily media used is Online video eg YouTube Facebook (63% v 52%)
  • Significantly higher users of SVOD daily (54% v 37%)
  • Significantly higher users of OnDemand daily (37% v 19%)
  • Significantly lower daily use of Linear TV than general population (55% v 66%)
  • Lower users of Free-to-air TV (32% v 37%)
  • Lower users of live radio than general population (47% v 55%)

The overtaking of traditional media by online for Pacific people is due to a significant decline in viewing via SKY TV (contributing to the linear TV decline) rather than an increase in online viewing.

There is also a significant decline in live radio listening since the 2016 study – down to 47% from 56%.

As with Māori, the Pacific population is skewed young (74% under 40) so the consumption behaviour is reflective of the generational divide.

Read full report below:

Pacific audiences infographic
Key findings - Lower socio-economic New Zealanders

For the purposes of this breakdown this is defined as New Zealanders who earn up to $50,000pa in either personal or combined income if they have a partner. (excluding students and retirees).

  • Linear TV is the Number One daily media used by this group although slightly less than the general population. (59% v 66%)
  • Online video eg YouTube, Facebook is the second most used media, slightly more than the general population. (56% v 52%)
  • This group is less likely to watch NZ Netflix and to subscribe to SkyTV but the difference isn’t huge (NZ Netflix (23% v 27%)
  • Watching TV via PayTV is lower than the general population (33% v 39%)

There are some differences, as you might expect, in access to devices and services for this group, compared to the general population.

Read full report below:

Subscribe

Sign up to receive communications such as media releases, newsletters and funding decisions.